
Int. J. Innov. Entrep. , 1(1), 4; doi:10.56502/IJIE1010004
Article
Blockchain Technology and Firm Performance
Norwich Business School, University of East Anglia, Norwich NR4 7TJ, UK; hony778@outlook.com
How to cite: Li, W. Blockchain Technology and Firm Performance. Int. J. Innov. Entrep., 2025, 1(1): 4; doi:10.56502/IJIE1010004.
Received: 29 December 2024 / Accepted: 21 January 2025 / Published: 4 February 2025
Abstract
:This paper investigates the factors influencing blockchain adoption and its impact on firm performance using a panel dataset of NASDAQ-listed companies. Drawing on the Resource-Based View and Transaction Cost Theory, we employ an Endogenous Treatment Effects model to address self-selection bias. The results reveal that organisational capabilities, such as firm size and sales growth, enable blockchain adoption, while intangible intensity and capital expenditure intensity act as barriers. Industry-wide adoption shows limited influence, suggesting underdeveloped network effects. Blockchain adoption significantly improves operational performance, as measured by Return on Assets (ROA), but has no significant effect on Tobin’s Q, a market-based performance measure. This result highlights investor scepticism and delayed value realisation. The study argues for strategic communication to bridge this perception gap and calls for policy initiatives to address adoption barriers and promote blockchain’s widespread implementation.
Keywords:
blockchain technology; technology adoption; profitability; Tobin’s Q1. Introduction
As one of the disruptive technologies of the 21st century, blockchain has captured wide attention since Bitcoin was launched in 2009 [1]. It originated from the disappointment to traditional centralised financial intermediaries and the trust crisis following the financial crisis in 2008 [2]. Therefore, the adoption of blockchain technology was initially limited to the finance industry, with the focus on digital currencies and payment systems [3]. Nevertheless, its applications and influences soon went beyond the finance industry, forming an important infrastructure of the digital economy [4,5]. However, the high expectations of blockchain technology are far from being unleashed in practice [6]. One recent example was the failure of TradeLens in the first quarter of 2023. This famous blockchain project was a joint venture by technology giant IBM and Maersk (the largest container shipping company in the world), but only one other carrier has joined the shipping blockchain network since its launch. The stagnant progress of blockchain adoption in practice presents a sharp contrast with the feverish hype of blockchain discussions in media and academia. To address the “high interest, low adoption” puzzle, this paper aims to answer two inter-related research questions (RQs):
- RQ1: What factors affect blockchain adoption of listed companies?
- RQ2: Does blockchain adoption affect performance of listed companies?
The existing literature has been developed in two directions along the two issues. On the one hand, the management literature analyses the barriers and enablers of blockchain adoption from an organisational perspective (RQ1). Popular theoretical frameworks include Transaction Cost Theory [7] and Resource-Based View [8]. Specifically, performance improvement usually belongs to perceived usefulness of blockchain (an enabler of blockchain adoption). On the other hand, the economic literature estimates the “treatment effect” of blockchain adoption on firm performance from a statistical perspective (RQ2). Econometric techniques like fixed-effect model [9] and Heckman selection model [10] are used to empirically identify the effect. However, the two strands of literature are often developed separately, lacking interdisciplinary integration. A methodological novelty of this paper is to integrate the two subject fields of management and economics, so that the qualitative review informs the quantitative model, and the econometric evidence empirically confirms the management theory.
2. Literature Review
A blockchain is a decentralised digital ledger that records transactions in a secure and verifiable manner. Each block in the chain contains a list of transactions that are cryptographically signed by a verifier and distributed across multiple nodes in the network. This creates a permanent and tamper-proof record of all transactions, making blockchains a key technology for secure and transparent data storage. Anyone can access and reverify historical transactions without the need of a trusted third party, which is known as the trustlessness feature.
Nevertheless, simply having appealing technological features is not sufficient for organisations to adopt blockchain. It involves various factors and a complex decision-making system. The following subsections first summarise the workings of blockchain technology, then review various major factors of blockchain adoption.
2.1. Workings of Blockchain Technology
To understand the impact of blockchain technology on firm performance, it is essential to first grasp the technical underpinnings of blockchain technology. A blockchain is a distributed, decentralised ledger that records transactions in a sequence of immutable blocks. The system relies on peer-to-peer (P2P) networks, cryptographic hashing, and consensus algorithms to ensure trust, security, and integrity without the need for a central authority.
A blockchain consists of a series of blocks, each containing the following components:
- Header: Includes metadata such as the previous block’s hash, timestamp, and nonce.
- Transactions: A list of all validated transactions stored in the block.
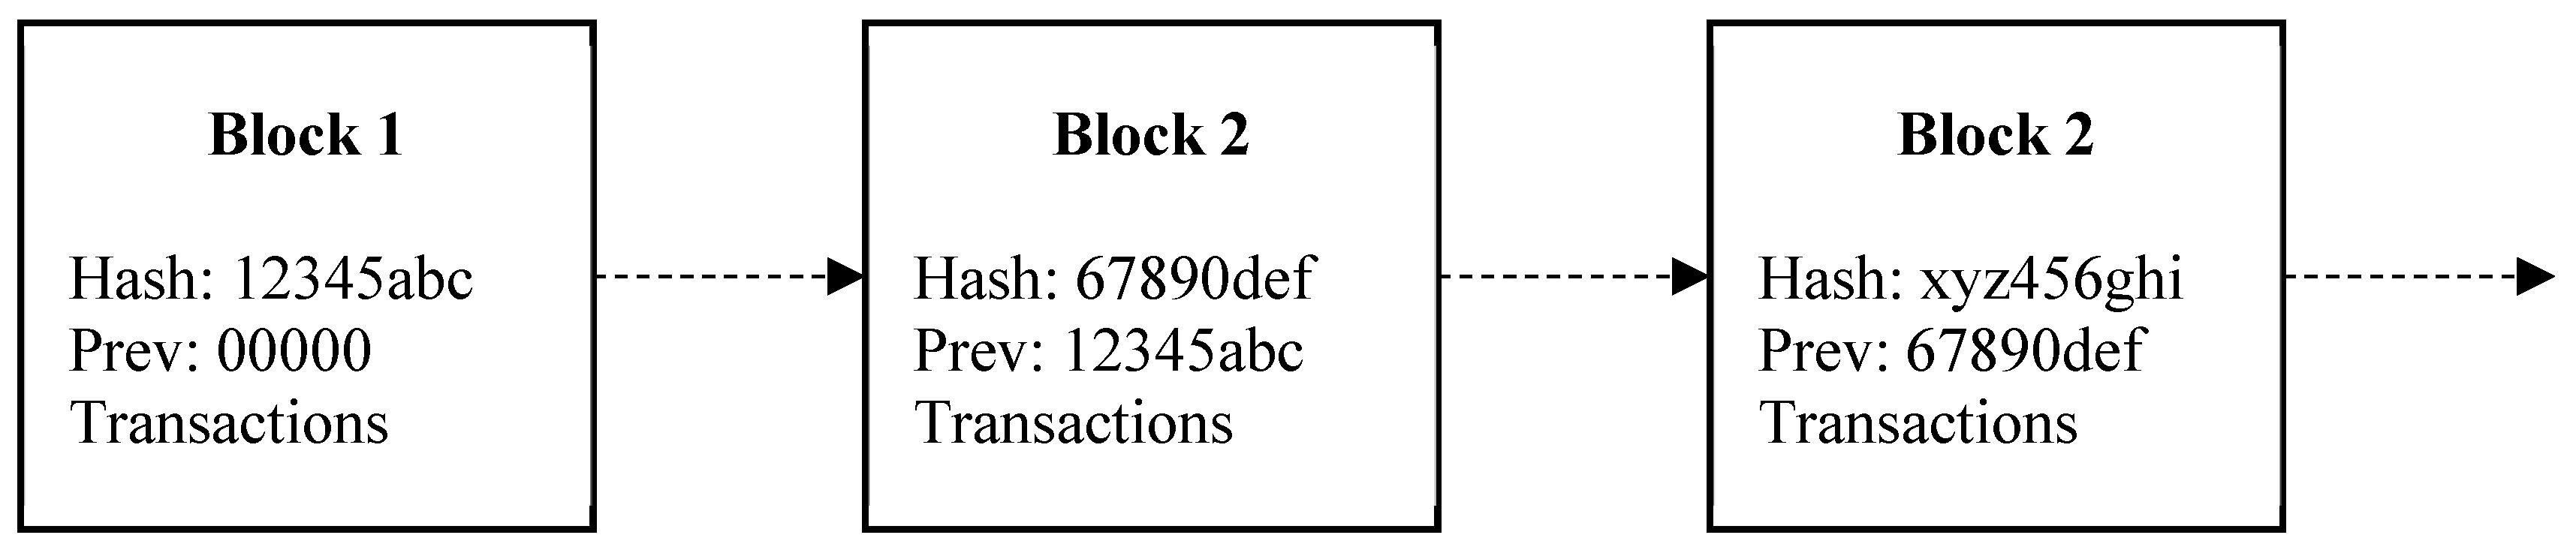
- Hash: Each block is uniquely identified by a cryptographic hash (e.g., SHA-256 for Bitcoin). The hash value is computed based on the block’s content, ensuring that even the smallest modification will alter the hash value, thus enabling tamper detection.
The chain is constructed such that each block contains the hash of its predecessor, forming a linked chain. This hash linkage ensures immutability, as altering one block requires recalculating hashes for all subsequent blocks, which is computationally infeasible. Figure 1 illustrates the simplified structure of a blockchain.
Figure 1.
Illustration of the simplified structure of a blockchain.
A blockchain operates on a distributed ledger shared across a network of nodes. Each node maintains a copy of the entire blockchain, ensuring redundancy and fault tolerance. However, to maintain consistency across the network, blockchain systems rely on consensus mechanisms, which are protocols to validate and agree on transactions. The most common consensus algorithms include:
- Proof of Work (PoW): Used in Bitcoin, PoW requires participants (miners) to solve complex mathematical puzzles to add a block to the chain. While secure, PoW is energy intensive.
- Proof of Stake (PoS): Nodes are selected to validate transactions based on their stake (ownership) in the network. PoS reduces energy consumption compared to PoW.
- Byzantine Fault Tolerance (BFT): Designed for permissioned blockchains, BFT ensures consensus even when some nodes act maliciously.
While blockchain offers significant technical advantages, it faces challenges such as scalability, latency, and high energy consumption. For example, Bitcoin’s PoW limits transaction throughput to ~7 transactions per second, far lower than traditional systems like Visa (~1700 TPS). Solutions such as sharding (dividing the network into smaller sub-networks) and Layer 2 protocols (e.g., Lightning Network) have been proposed to address these limitations.
2.2. Factors of Blockchain Adoption
The management literature has identified a long list of factors of blockchain adoption. There are two ways of classifying them: one is the context of the factor (technology, organisation, or environment), and the other is the sign of the effect (enabler or barrier). The former (context) is also the basis for one of the models in the next subsection, so this subsection uses the latter (sign) as the main criterion—whether the factor is an enabler or a barrier of blockchain adoption.
The major adoption-enabling factors include: trustlessness, connectivity, legitimacy, competition, efficiency, traceability, adaptability, decentralisation, immutability, and transparency. Specifically, the concept of trustlessness in blockchain technology has garnered significant attention among financial industry practitioners such as JPMorgan Chase and Visa. Despite that finance was the earliest application of blockchain, the technology per se is not limited to finance. Many other industries have adopted the technology to improve communication (connectivity) in local, national, and global supply chains. For example, Walmart developed a blockchain-based tracing system in 2018 to track the source of its food products within 2.2 s which used to take about a week [11]. DHL and Accenture co-developed to create a blockchain-based prototype for serialising pharmaceutical products and tracking them throughout the global supply chain [12].
According to the latest Gartner Hype Cycle, blockchain applications are still far from reaching the stage of widespread adoption and productive use. There is a significant gap between high expectations and actual implementation of blockchain technology in the business sector, as noted in recent management literature. There is also a risk of rushing into adoption without a thorough understanding of the “trustlessness” concept, which could lead to negative consequences. As a result, there are many barriers against blockchain adoption, with most business applications still in pilot test environments. A more detailed review of these factors can be found in [1].
3. Methods
The existing literature largely relies on qualitative approaches to develop conceptual frameworks and exploratory theories. Large-scale empirical evidence on the causes and effects of blockchain adoption is scanty [9]. This paper aims to fill this gap by using the NASDAQ-listed companies as the sample to perform a confirmatory, quantitative study.
3.1. The Data
A panel dataset will be collected by combining publicly available records of listed firms’ performance and manually retrieved records of blockchain adoption based on text analysis. The measures of firm performance can be accounting measures such as return on assets (ROA) or return on equity (ROE). Another popular indicator of firm performance is Tobin’s Q, which is a market-based measure [9]. It is defined as the ratio between the market value of the company (market value of shareholder’s equity + book value of liabilities) and the book value of total assets. The advantage of Tobin’s Q over the accounting measures is that Tobin’s Q is forward looking, while ROA and ROE are backward looking.
Blockchain adoption may not have immediate benefits, but its value can be reflected in the market expectations and stock prices. The data on come from two independent sources. One is based on the NASDAQ blockchain economy index, which provides a time-varying portfolio of companies that develop blockchain technology, provide blockchain-related services, and operate in industries that are expected to benefit from the adoption of blockchain technology. Some of the largest constituents of the index include Square, NVIDIA, and IBM. The index is one of the most widely followed blockchain indexes and is an important barometer of the health and growth of the blockchain industry. It results in a binary variable, equal to 1 if the firm is included in the index, and 0 otherwise. The constituents change on a regular basis, so it forms a panel data. The other is based on basic text analysis of EDGAR Company Filings for listed companies. It results in a binary variable, equal to 1 if the firm’s annual report mentions blockchain, and 0 otherwise.
Additionally, other control variables, such as intangible intensity, market dynamism, technological dynamism, R&D intensity, leverage, foreign assets, sales growth, firm size, and industry dummies, are retrieved from Bloomberg based on company tickers. Table 1 summarises descriptive statistics of the variables in the regressions.

Table 1.
Descriptive statistics.
| Obs. | Mean | Std. Dev. | Min | Max | |
|---|---|---|---|---|---|
| ROA | 1308 | 8.2696 | 7.7376 | −48.7694 | 42.2794 |
| Tobin’s Q | 1312 | 2.4361 | 3.6447 | 0.0249 | 74.7965 |
| NASDAQ | 1400 | 0.0950 | 0.2933 | 0 | 1 |
| EDGAR | 1400 | 0.1279 | 0.3341 | 0 | 1 |
| industry adoption | 1400 | 0.0950 | 0.1464 | 0 | 0.4762 |
| capital expenditure intensity | 1230 | 6.9708 | 10.3721 | 0.0627 | 107.9378 |
| intangible intensity | 1217 | 9.8655 | 11.9251 | 0 | 56.6348 |
| sales growth | 1089 | 8.5046 | 17.4801 | −61.0157 | 188.9585 |
| assets size (ln) | 1312 | 25.1113 | 1.2659 | 20.9778 | 28.9511 |
| employment size (ln) | 1297 | 11.1095 | 1.2651 | 7.5730 | 14.6484 |
| ROTA rank | 1135 | 0.5062 | 0.2888 | 0.0115 | 1 |
3.2. The Endogenous Treatment Effect Model
Based on the literature review and data availability, we estimate an ETE model consisting of a selection Equation (1) the model of adoption, and an outcome Equation (2) the model of performance. The qualitative literature review in Section 2 informs what factors to include in the two equations. The quantitative econometric model to be estimated is a structural system:
is the dummy variable, equal to 1 if blockchain is adopted by firm at time and 0 if not. is a vector of firm attributes (enablers and barriers) that affect the decision of . Fixed effects () are controlled for to capture the specific firm attributes. The firm performance is a linear (or log-linear) function of a set of firm attributes , blockchain adoption , and fixed effects (). To correct for the self-selection bias or endogeneity of , the Inverse Mill’s Ratio (IMR) is computed from the selection equation and included in the outcome equation [13,14].
4. Results
We first report the baseline estimation results of Equations (1) and (2), which are then challenged in various ways to test the robustness.
4.1. Factors of Blockchain Adoption
Table 2 presents the estimated effects of factors on the selection Equation (1). Columns (A)–(C) are based on the NASDAQ blockchain economy index as the measure of , while columns (D)–(F) are based on the EDGAR Company Filings.
Table 2.
Estimation results of the selection equation.
| (A) | (B) | (C) | (D) | (E) | (F) | |
|---|---|---|---|---|---|---|
| Dep. Var. | NASDAQ | NASDAQ | NASDAQ | EDGAR | EDGAR | EDGAR |
| capital exp. intensity | −0.029 | −0.0328 | −0.0338 | −0.0401 ** | −0.0471 ** | −0.0433 ** |
| intangible intensity | −0.0584 *** | −0.0578 *** | −0.0577 *** | −0.0488 *** | −0.0481 *** | −0.0480 *** |
| sales growth | 0.0116 ** | 0.0121 ** | 0.0078 | 0.0107 ** | 0.0115 *** | 0.0095 ** |
| assets size (ln) | 0.6089 *** | 0.6124 *** | 0.6419 *** | 0.4935 *** | 0.4967 *** | 0.5074 *** |
| employment size (ln) | −0.1133 | −0.1143 | −0.1104 | −0.1996 ** | −0.2045 ** | −0.2008 ** |
| ROTA rank | 0.9112 ** | 0.8493 ** | 0.9220 *** | 0.4638 | 0.352 | 0.4542 |
| BC proportion | 3.1220 | 3.0391 | 3.4660 | 3.0869 * | 3.0151 * | 3.0928 * |
| firm FE | Yes | Yes | Yes | Yes | Yes | Yes |
| year FE | Yes | Yes | Yes | Yes | Yes | Yes |
| Obs. | 321 | 900 | 901 | 537 | 900 | 901 |
| Method | OLS | ETE | ETE | OLS | ETE | ETE |
| Equation(s) | NAS | NAS + ROA | NAS + Q | EDG | EDG + ROA | EDG + Q |
Notes: significance * = 10%, ** = 5%, *** = 1%.
The results show mixed evidence for RBV. Firm size (assets size) emerges as a significant positive factor across all specifications, regardless of the measure of blockchain adoption. Larger firms are more likely to adopt blockchain technology, reflecting their greater capacity to allocate resources and absorb the high costs of integrating new technologies. This supports RBV’s assertion that firm capabilities are critical enablers of technology adoption. However, the role of employment size as a proxy for organisational resources provides contrasting results. While it is not significant for the NASDAQ-based measure, it is negatively associated with blockchain adoption in the EDGAR-based models. This suggests that larger workforces may pose internal resistance or inertia in adopting blockchain, highlighting organisational rigidity as a potential barrier.
The negative and significant coefficients on intangible intensity across all models indicate that firms with higher intangible capital (e.g., patents, R&D) are less likely to adopt blockchain. This contradicts the expectation that firms heavily invested in innovation would lead in adopting emerging technologies. Instead, it may reflect the cautious approach of R&D-intensive firms, where existing intangible assets create path dependency and reduce the perceived need for blockchain integration.
Under TCT, industry-wide adoption (captured by BC proportion) is expected to reduce transaction costs and encourage further adoption. However, the results provide limited support for this hypothesis. The coefficient on BC proportion is insignificant in the NASDAQ-based models but becomes marginally significant at the 10% level for the EDGAR-based models. This weak association suggests that, while industry adoption may influence decisions at the margin, firms do not primarily base their adoption decisions on broader transaction cost reductions enabled by blockchain.
The absence of strong evidence for TCT reflects the nascent stage of blockchain technology adoption, where network effects and industry-wide externalities remain underdeveloped. Firms are still navigating early implementation challenges rather than benefiting from fully realised transaction cost savings.
4.2. Effects of Blockchain Adoption
The results in Table 3 analyse the impact of blockchain adoption on firm performance, using ROA as the dependent variable. The table provides estimates using both OLS and the ETE model, which corrects for the self-selection bias associated with firms’ blockchain adoption decisions.
The results indicate that blockchain adoption has a significant and positive impact on firm performance, as measured by ROA. This effect is consistent across both NASDAQ-based and EDGAR-based measures of blockchain adoption. The NASDAQ-based measure shows a statistically significant coefficient of 2.4798 in the OLS model (column A) and 2.1573 in the ETE model (column B). The EDGAR-based measure also produces significant positive coefficients of 2.2498 (OLS, column C) and 1.5952 (ETE, column D).
These results confirm that firms adopting blockchain technology experience higher ROA compared to non-adopters. However, it is critical to note the overestimation bias in the OLS results. The coefficients estimated using OLS (columns A and C) are larger than those derived from the ETE model (columns B and D), suggesting that failing to account for the endogeneity of blockchain adoption leads to an inflated estimate of its effect on performance. By explicitly modelling the adoption decision and correcting for selection bias, the ETE results provide a more reliable and conservative estimate of the impact.
Table 3.
Estimation results of the outcome equation of ROA.
| (A) | (B) | (C) | (D) | |
|---|---|---|---|---|
| Dep. Var. | ROA | ROA | ROA | ROA |
| NASDAQ | 2.4798 *** | 2.1573 ** | ||
| EDGAR | 2.2498 *** | 1.5952 | ||
| capital expenditure intensity | −0.0079 | −0.0085 | −0.0037 | −0.0061 |
| intangible intensity | −0.2107 *** | −0.2129 *** | −0.2119 *** | −0.2164 *** |
| sales growth | 0.0212 ** | 0.0216 ** | 0.0210 ** | 0.0219 ** |
| assets size (ln) | −0.4882 ** | −0.4648 * | −0.4649 * | −0.4194 * |
| employment size (ln) | −0.9749 *** | −0.9848 *** | −0.9601 *** | −0.9865 *** |
| ROTA rank | 14.2389 *** | 14.2667 *** | 14.3479 *** | 14.3783 *** |
| firm FE | Yes | Yes | Yes | Yes |
| year FE | Yes | Yes | Yes | Yes |
| Obs. | 900 | 900 | 900 | 900 |
| Method | OLS | ETE | OLS | ETE |
| Equation(s) | ROA | NAS + ROA | ROA | EDG + ROA |
Notes: significance * = 10%, ** = 5%, *** = 1%.
The results in Table 4 assess the effect of blockchain adoption on firm performance using Tobin’s Q as the dependent variable, a market-based measure that reflects investor expectations regarding a firm’s future performance. The table compares the results of OLS and the ETE model to correct for the self-selection bias associated with blockchain adoption.
The results show a notable discrepancy in the effect of blockchain adoption on Tobin’s Q compared to ROA in Table 3. The findings can be summarised as follows. The NASDAQ-based measure of blockchain adoption produces a significant and positive coefficient of 1.2540 in the OLS model (column A). However, after correcting for selection bias using the ETE model (column B), the coefficient drops to 0.512 and becomes statistically insignificant. The EDGAR-based measure yields a significant and positive coefficient of 0.8244 in the OLS model (column C). Similar to the NASDAQ case, this effect becomes smaller and insignificant (0.4088) in the ETE model (column D).
These results indicate that while blockchain adoption appears to positively influence Tobin’s Q when using OLS, the effect disappears after accounting for the endogeneity of adoption. The significant OLS results reflect an upward bias due to self-selection—firms adopting blockchain are systematically different in ways that influence market expectations. The ETE model corrects for this bias, revealing that blockchain adoption fails to produce a statistically significant improvement in Tobin’s Q.
Table 4.
Estimation results of the outcome equation of Tobin’s Q.
| (A) | (B) | (C) | (D) | |
|---|---|---|---|---|
| Dep. Var. | Tobin’s Q | Tobin’s Q | Tobin’s Q | Tobin’s Q |
| NASDAQ | 1.2540 *** | 0.512 | ||
| EDGAR | 0.8244 *** | 0.4088 | ||
| capital expenditure intensity | 0.0067 | 0.0055 | 0.0077 | 0.0062 |
| intangible intensity | −0.0424 *** | −0.0474 *** | −0.0452 *** | −0.0480 *** |
| sales growth | 0.0224 *** | 0.0233 *** | 0.0227 *** | 0.0233 *** |
| assets size (ln) | −1.3020 *** | −1.2482 *** | −1.2684 *** | −1.2395 *** |
| employment size (ln) | −0.3696 *** | −0.3924 *** | −0.3748 *** | −0.3916 *** |
| ROTA rank | 0.5186 | 0.5823 * | 0.5881 * | 0.6073 * |
| firm FE | Yes | Yes | Yes | Yes |
| year FE | Yes | Yes | Yes | Yes |
| Obs. | 901 | 901 | 901 | 901 |
| Method | OLS | ETE | OLS | ETE |
| Equation(s) | Q | NAS + Q | Q | EDG + Q |
Notes: significance * = 10%, ** = 5%, *** = 1%.
The findings suggest that while blockchain adoption improves operational efficiency (ROA), its effects are not yet reflected in market-based measures like Tobin’s Q. This disconnect could slow the adoption of blockchain technology, as firms may not see immediate market rewards for their investments. For policymakers and practitioners, the results emphasise the need to bridge this perception gap through clearer demonstration of blockchain’s long-term value and strategic communication to investors.
5. Conclusions
This study investigates the factors influencing blockchain adoption and its subsequent effects on firm performance among NASDAQ-listed companies, integrating insights from the RBV and TCT. Using a panel dataset and an ETE model, the analysis addresses the endogeneity of blockchain adoption and provides robust evidence to inform managerial and policy discussions.
The findings reveal several critical insights into blockchain adoption and firm performance. First, firm-level characteristics, particularly organisational capabilities such as firm size and sales growth, act as key enablers of blockchain adoption, consistent with the RBV. However, higher intangible intensity and capital expenditure intensity serve as barriers, reflecting resource constraints and organisational rigidity. The evidence for industry-wide adoption (TCT) as a facilitator is weak, suggesting that network effects and transaction cost reductions from blockchain are yet to materialise fully.
Second, blockchain adoption has a positive and significant effect on operational performance as measured by ROA. This result holds after correcting for self-selection bias, underscoring blockchain’s ability to improve internal efficiencies and enhance resource utilisation. However, the study finds no significant effect of blockchain adoption on market-based performance (Tobin’s Q) after correcting for bias. This discrepancy indicates that while blockchain adoption generates tangible operational benefits, these improvements are not yet recognised by investors, reflecting market scepticism and delayed value realisation.
The positive impact of blockchain adoption on ROA highlights its ability to improve operational efficiency. Managers should prioritise organisational readiness, including capability-building and resource allocation, to overcome internal barriers such as capital intensity and intangible path dependency. Firms should also communicate clear strategies and tangible use cases to investors to bridge the perception gap and realise blockchain’s long-term market value.
Funding
No funding is received for this research.
Conflicts of Interest
The author does not have any conflicts of interest.
References
- Zhang, Y.; Tavalaei, M.M.; Parry, G.; Zhou, P. Evolution or involution? A systematic literature review of organisations’ blockchain adoption factors. Technol. Forecast. Soc. Change 2024, 208, 123710. [Google Scholar] [CrossRef]
- De Filippi, P.; Mannan, M.; Reijers, W. Blockchain as a confidence machine: The problem of trust & challenges of governance. Technol. Soc. 2020, 62, 101284. [Google Scholar]
- Zhang, Y.; Gong, B.; Zhou, P. Centralized use of decentralized technology: Tokenization of currencies and assets. Struct. Change Econ. Dyn. 2024, 71, 15–25. [Google Scholar] [CrossRef]
- Xu, Y.; Su, B.; Pan, W.; Zhou, P. A high-frequency digital economy index: Text analysis and factor analysis based on big data. Appl. Econ. Lett. 2023, 1–6. [Google Scholar] [CrossRef]
- Guo, D.G.; Zhou, P.Z. The evolution of financial market infrastructure: From digitalization to tokenization. Int. J. Innov. Entrep. 2023, 2, 2. [Google Scholar] [CrossRef]
- Dehghani, M.; William Kennedy, R.; Mashatan, A.; Rese, A.; Karavidas, D. High interest, low adoption. A mixed-method investigation into the factors influencing organisational adoption of blockchain technology. J. Bus. Res. 2022, 149, 393–411. [Google Scholar] [CrossRef]
- Chen, W.; Botchie, D.; Braganza, A.; Han, H. A transaction cost perspective on blockchain governance in global value chains. Strateg. Change 2022, 31, 75–87. [Google Scholar] [CrossRef]
- Chaudhuri, A.; Subramanian, N.; Dora, M. Circular economy and digital capabilities of SMEs for providing value to customers: Combined resource-based view and ambidexterity perspective. J. Bus. Res. 2022, 142, 32–44. [Google Scholar] [CrossRef]
- Sharma, P.; Shukla, D.M.; Raj, A. Blockchain adoption and firm performance: The contingent roles of intangible capital and environmental dynamism. Int. J. Prod. Econ. 2023, 256, 108727. [Google Scholar] [CrossRef]
- Xu, R.; Guan, E. Can blockchain innovation promote total factor productivity? Evidence from chinese-listed firms. Appl. Econ. 2023, 55, 653–670. [Google Scholar] [CrossRef]
- Niu, B.; Shen, Z.; Xie, F. The value of blockchain and agricultural supply chain parties’ participation confronting random bacteria pollution. J. Clean. Prod. 2021, 319, 128579. [Google Scholar] [CrossRef]
- Tiwari, S.; Sharma, P.; Choi, T.-M.; Lim, A. Blockchain and third-party logistics for global supply chain operations: Stakeholders’ perspectives and decision roadmap. Transp. Res. Part E Logist. Transp. Rev. 2023, 170, 103012. [Google Scholar] [CrossRef]
- Foreman-Peck, J.; Zhou, P. R&D subsidies and productivity in eastern European countries. Econ. Syst. 2022, 46, 100978. [Google Scholar]
- Foreman-Peck, J.; Zhou, P. Specialisation precedes diversification: R&D productivity effects. Res. Policy 2023, 52, 104808. [Google Scholar]
© 2025 Copyright by Author. Licensed as an open access article using a CC BY 4.0 license.